June 19, 2026
How to extract figures from a PDF without breaking them
Figures are where PDF conversion quietly breaks: a chart loses its axis labels, or one figure splits into pieces. Here's why it happens, and how to get figures out whole, labels and all, so an AI can actually read them.
Jerome
Builder of pdfmarkdown.app
Almost everyone who runs a PDF through our converter does the same thing next: they hand the result to an AI. They paste it into ChatGPT, drop it into NotebookLM, or save it to a notes app that reads and summarizes for them. So that is the job I hold us to. Not “produce a Markdown file.” Produce a Markdown file an AI can actually read without losing the plot.
Disclosure: I build pdfmarkdown.app, an in-browser PDF→Markdown converter, so I have a horse in this race. The examples below are real, run on real papers, and the claims are checkable. Test anything here yourself.
That goal gives us three rules we try hard not to break:
- AI-friendly first. The output is going to be read by a machine, so anything that carries meaning has to survive. If a person glances at it and it looks roughly right, that is not enough. The AI reads what is actually there, not what you assume is there.
- Lose nothing. Keep the original information, including the small stuff. The tick numbers on a chart. The fact that two pieces are really one figure. The caption that belongs to it.
- Keep it checkable. You should be able to look at the result and trust it, or spot quickly where it went wrong.
Easy to write down. The place those rules get tested hardest is figures, especially in academic papers. So let me show you what goes wrong, using a paper you probably know, and then how to get it right.
A chart that looks fine and isn’t
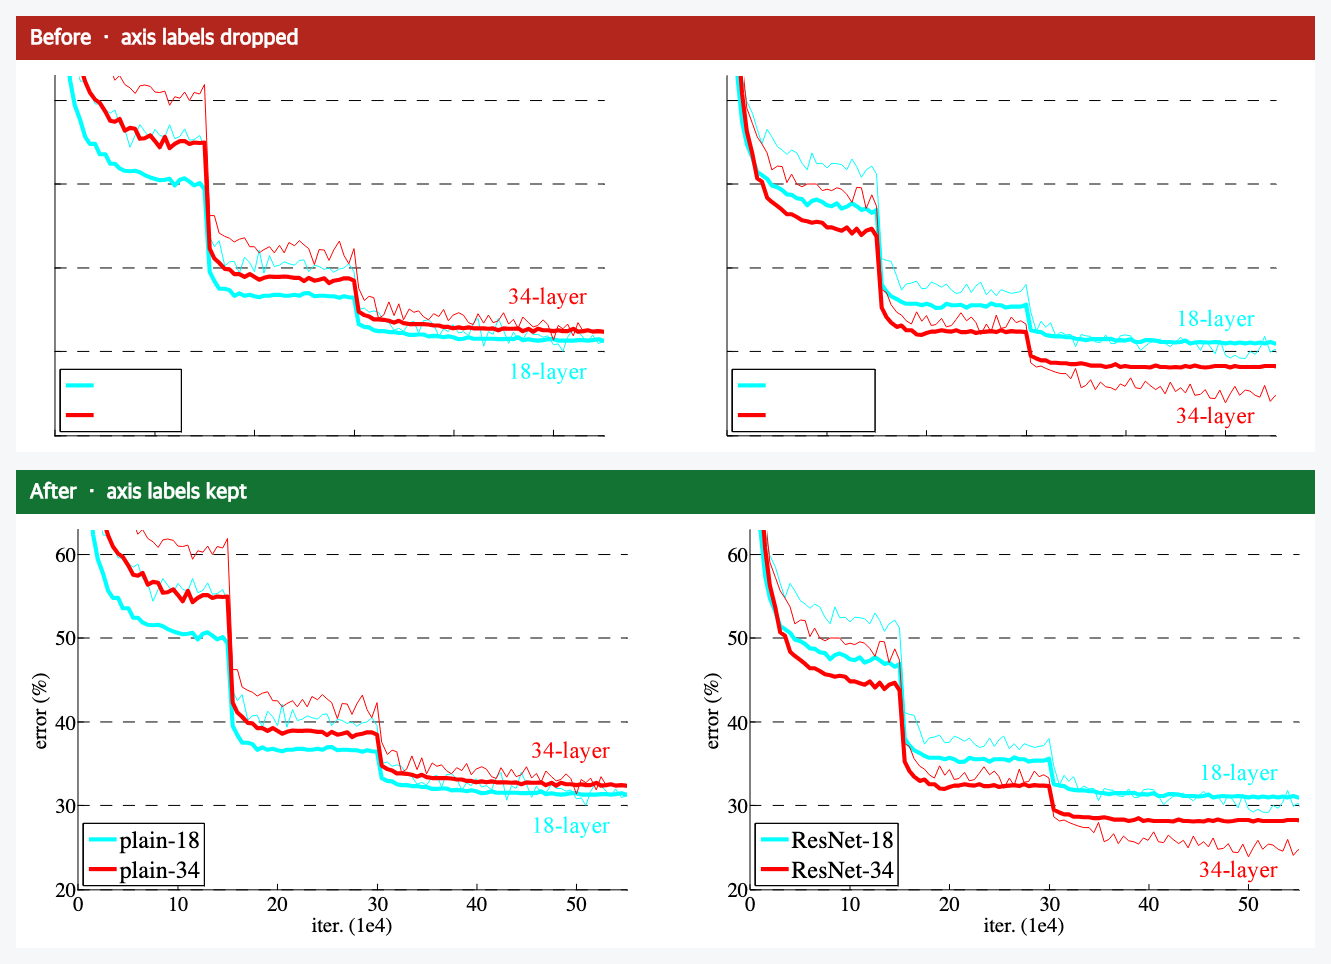
I ran the ResNet paper through a converter recently, to read it alongside an AI. One of its charts came out looking fine at a glance. Then I went to read the actual numbers off it, and there weren’t any. The plotted lines were there, the legend was there, but every number on both axes had quietly vanished. No error rate up the side, no iteration count along the bottom.
To your eye, skimming, you might not even notice. To an AI, that chart is now close to noise. It sees a few lines drifting downward and has no idea down to what, or over how long. The information that made it a chart is gone, and nothing flagged that it left. That is the worst kind of error: the silent one.
Figures break in two ways
Once we started pulling on this, figures turn out to break in two distinct ways when a PDF becomes text. They have different causes, so they are worth naming separately.
One, information goes missing. The figure is there, but text inside it disappears: axis numbers, axis names, labels on a diagram. That is the chart above.
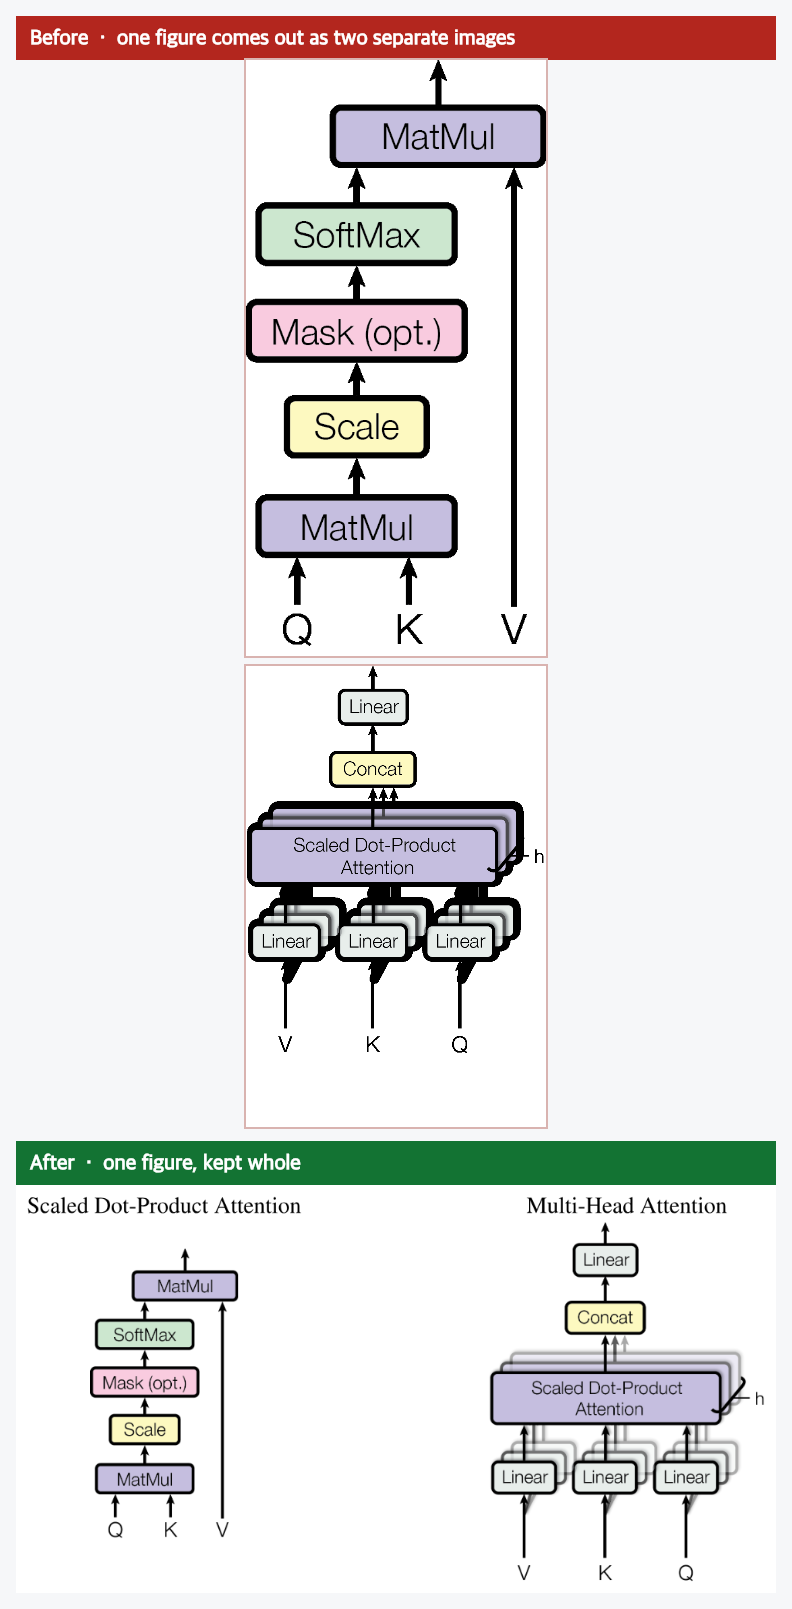
Two, the layout falls apart. What you see as one figure comes out as several disconnected pieces, often stacked in the wrong order, with the caption attached to only one of them. Here is the attention diagram from the Transformers paper. You know it as a single figure. A typical extraction returns it as two separate images, one piled on top of the other, because the file never said they were one picture.
Why it happens
None of this is the paper’s fault, and it is not really the converter being lazy either. It comes down to what a PDF actually is.
A PDF is a picture of a page, not the page’s meaning. It records where every mark sits, and that is mostly all it records. It does not say “this is a figure,” or “these digits are the scale on an axis,” or “these two images are one picture.” Put plainly: a PDF doesn’t know it has a chart. We checked both of these papers, and none of that meaning is written down anywhere in the file. So whatever rebuilds the page has to work it out from a pile of marks.
That explains both failures.
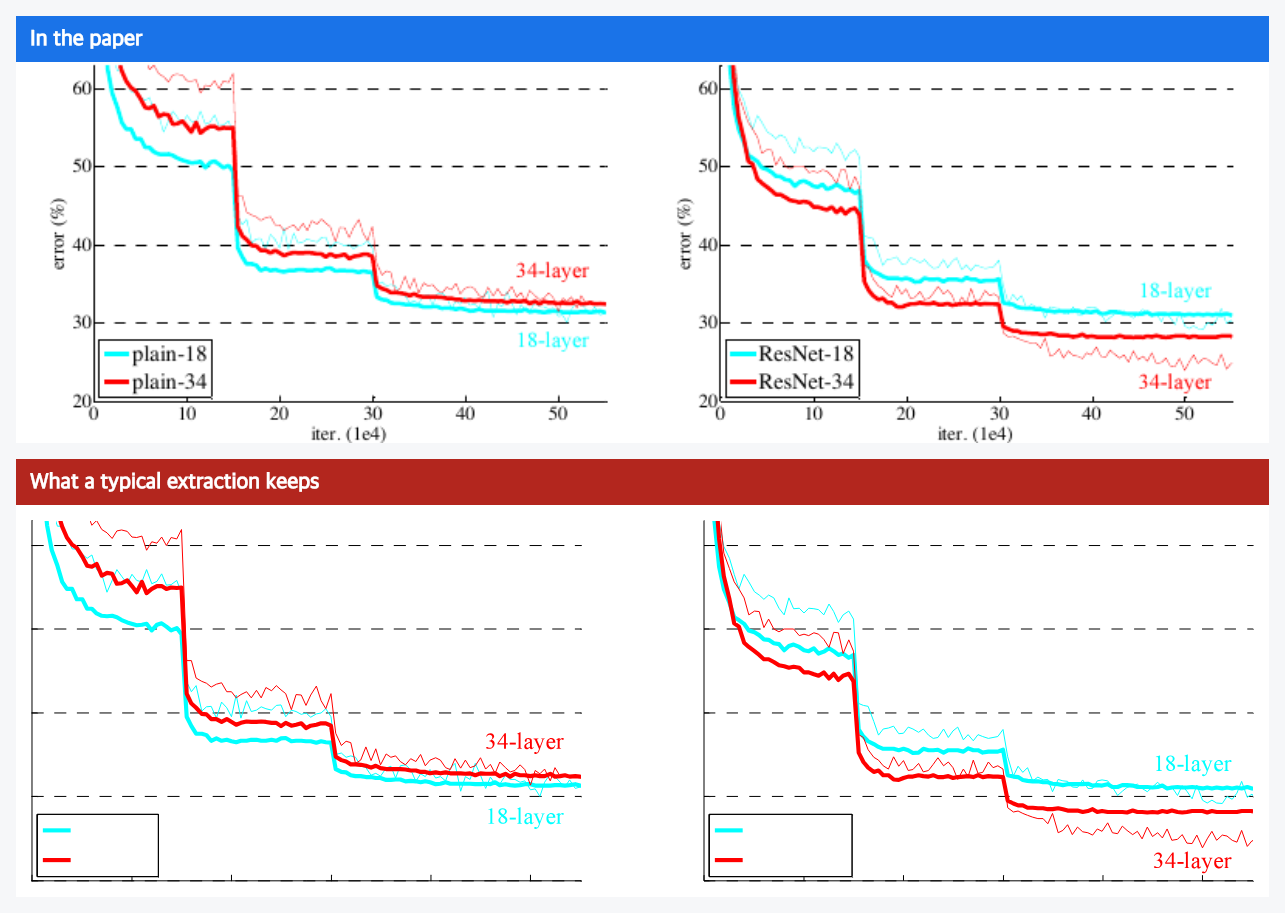
The missing labels are a font story. Most of the text on that ResNet page survives fine, because the file carries the fonts it needs. But the axis numbers happen to use one of a small set of “standard” fonts that the PDF format assumes every reader already has, so the file does not bother to include it. We rebuild each figure privately, right inside your browser, so your document is never uploaded anywhere. In that private setting there is no copy of that one standard font to draw from, and those particular characters come out blank. It is like a recipe that says “add the house spice blend.” Fine in the kitchen that mixed it, useless to you at home with a different set of jars. Everything else on the page kept its own fonts, which is exactly why only the axis numbers went missing.
The split figure is simpler. The file stored that one diagram as two separate images and never linked them. A quick pass treats them as two figures, stacks them, and pins the caption to one. It is a jigsaw tipped out with no picture on the lid and no hint about which pieces make which image.
How to get figures out whole
So the fix is to do the extra work the file skips. For the missing text, we catch the labels that are about to disappear and draw them back in, in the right place and at the right size, before the figure is saved. For the split figure, we look at where the pieces sit, work out that they are one picture, put them back together, and reattach the caption. The fixed chart at the top of this page and the merged figure above are both the real results, run on the real papers.
One thing I care about: we only fix what is broken. For figures that were already complete, we change nothing at all. They come out identical to before, down to the byte. The job is to restore what the PDF dropped, not to repaint things that were already right.
And if you do not even want Markdown, if you just want the figures themselves as clean images, you can take those too. They come out whole, labels and all.
How to tell if your converter is breaking figures
You do not need to take my word for it. Whatever tool you use, run this quick check on a PDF that has charts or multi-part diagrams:
- Open a chart in the result and look for the numbers. Are the axis labels and tick numbers still there? If the lines survived but the scale did not, the chart is decorative now, not data.
- Find a figure that is really two pictures side by side. Did it come out as one figure with its caption, or did it fall apart into separate images?
- Check a diagram’s inner labels. Boxes and arrows with no words are just boxes and arrows.
That one look tells you more about a tool’s fidelity than any feature list. (If you want a starting point, I keep a running comparison of PDF-to-Markdown tools.)
This is what high fidelity means to us in practice. Not a slogan about quality, but a stubborn refusal to let your document quietly lose pieces of itself on the way to an AI. Charts keep their axes. Figures stay whole. The caption stays with its figure.
You can try ours on your own file right now. It runs entirely in your browser, your document is never uploaded, and your figures keep their labels and their shape.